Mapping Electoral Votes and Unemployment in the US
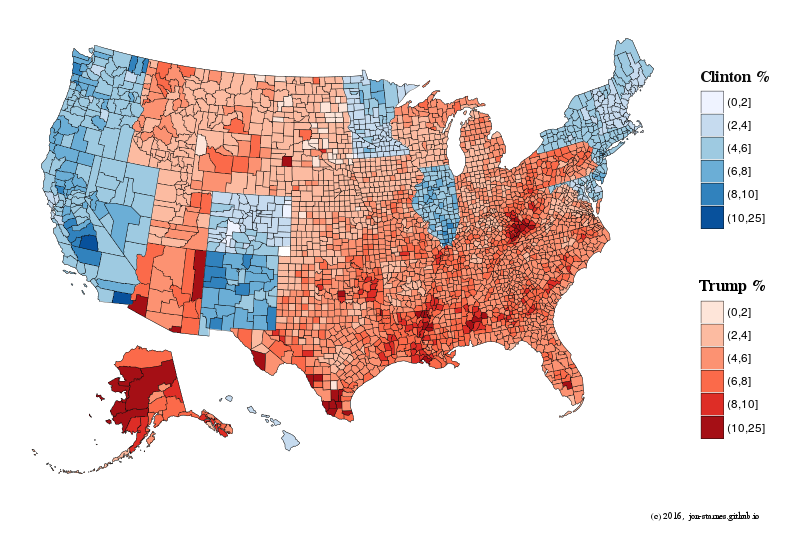
This map shows states that Trump and Clinton won for electoral votes in 2016, and it also shows the unemployment rate (UER) for every county in the US 50. The scale starts at 0-2% and increases in increments of two, the highest unemployment rate ranges from 10-25%. The mean and max unemployment were very similar for Trump (4.9%, 21%) and Clinton (4.8, 22%), but the spread among states is noticeably different.
The high unemployment (>10%) in Clinton’s states were only in California in Imperial and Tulare Counties. Counties with unemployment higher than 10% were peppered throughout the states Trump won. Even though Clinton took California, Trump still won the majority of votes in several counties, including in Tulare County. More in progress.
Electoral Votes and Unemployment Rates: 2016
References: 2016 California Presidential Election Results
Methods
The 2016 electorate college results were sourced from a table hosted by Google. County unemployment data were pulled from the Bureau of Labor Statistics website via the API for R. the map was created using layers of us county map data in R with the ggplot package.
Recent Posts
-

An Introduction to Using Google BigQuery in R
Posted on 28 Jan 2017 -
Mapping Electoral Votes and Unemployment in the US
Posted on 13 Nov 2016 -
Bureau of Labor Statistics Data with Minor Data Munging
Posted on 26 Aug 2016 -
Bureau of Labor Statistics Data with blscrapeR: US Unemployment
Posted on 23 Aug 2016